Check 3 Fibonacci Retracement Levels Before Buying a Dip
BTC drops 11% in a six-hour liquidation cascade. Longs get flushed, funding flips negative, and Twitter lights up with "buying the dip" posts from the same accounts that were calling for more downside forty-eight hours earlier.
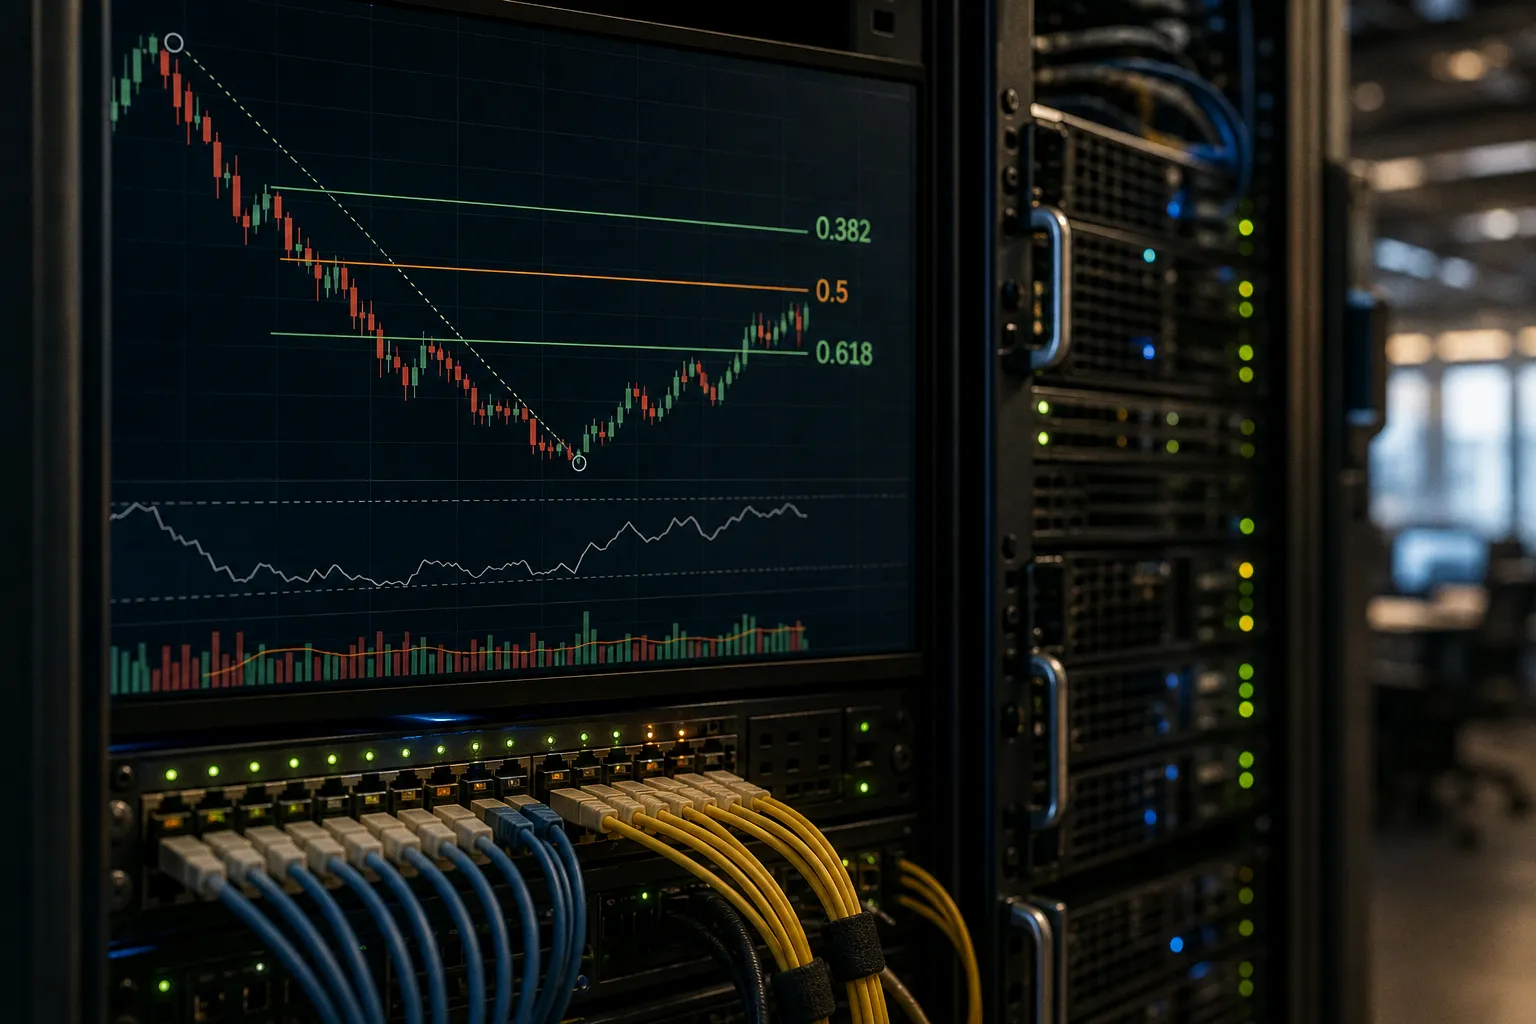
This is the standard retail trap — buying the dip on emotion instead of on levels that actually mean something. The three Fibonacci retracement numbers that matter before you commit capital are 0.382, 0.5, and 0.618. Most traders scribble them on a chart and treat each line like a price magnet. That's the fastest path to a margin call. These levels are zones of interest, not absolute support walls. Treat them as checkpoints: confirmation above, invalidation below, no ego in between.
Defining the Three Levels and What They Actually Mean
The three Fibonacci retracement levels that get real attention in crypto are 0.382, 0.5, and 0.618. Anything outside that band — 0.236 on the shallow side, 0.786 on the deep side — is either noise or capitulation territory. A shallow tag doesn't mean anything in a market that just went vertical. A deep tag means the trend structure is probably already gone.
- 0.382 — a shallow retracement. Common in runaway trends where the dominant side barely gives back ground. Weak bounce candidate on its own.
- 0.5 — the psychological midpoint. Not a true Fibonacci number by origin, but it pulls massive eyeball attention because of how clean the math reads on a chart. Decent first-entry zone in a healthy uptrend if other factors line up.
- 0.618 — the Golden Ratio. This is where smart money typically loads. The deepest "healthy" pullback in a trending market before the structure starts breaking down. Often called the primary reversal zone because it's where the highest-probability bounce lives.
The 0.618 level isn't a wall. It's a checkpoint. If price closes below it on volume, your dip-buy thesis is dead — pull the plug before the bleed compounds.
The piece most amateurs skip: these aren't support lines, they're probabilities. A market can chew through 0.618 and keep running. The level tells you where buyers might step in — it doesn't promise they will. Treat any level that hasn't been confirmed as decoration, not direction.
Mapping Swing Highs and Lows for Accurate Tool Placement
Fibonacci retracement is only as accurate as the swing points you anchor it to. Pick the wrong high or wrong low and every percentage on your chart becomes fiction.
The rule is straightforward: identify the most recent impulsive leg — the strong, clean move that defines the prevailing trend. Draw from swing low to swing high in an uptrend. Draw from swing high to swing low in a downtrend. The tool then auto-calculates the retracement percentages between those two anchor points.
Common mistakes that destroy the setup before it ever triggers:
- Anchoring on a wick instead of a candle close. A long wick down through support tells you rejection happened, not where the trend actually began. Closes are truth. Wicks are noise.
- Using micro-swings on a 5-minute chart while trading a swing position. Your anchors must match your holding period. Day traders work 15-minute to 1-hour swings. Swing traders work 4H and daily swings. Position traders anchor weekly.
- Picking the latest minor high while ignoring the dominant move that started three weeks ago. The chart has noise; the trend is what matters.
- Repainting the levels after price has already moved. If you anchor after the move, you're fitting the level to the narrative you want. That's confirmation bias, not analysis.
If you're trying to buy a dip inside an uptrend, anchor from the bottom of the most recent significant low to the top of the most recent significant high. If those two points aren't obvious without squinting and zooming, the chart probably isn't ready for a Fib trade — wait for structure to clarify.
Evaluating 0.382, 0.5, and 0.618 in Volatile Crypto Markets
Crypto doesn't respect Fibonacci levels the way textbooks promise. BTC and major alts regularly slice through 0.382, tap 0.5, and bounce — or blow straight through 0.618 in a single candle and never look back. That's why you don't enter at the first tag. You wait for reaction.
How to triage each level:
- 0.382 tag — high-risk entry. Shallow pullbacks hold only in extreme momentum environments. If price taps 0.382 in a slow grind, expect 0.5 next. Wait for a clean rejection candle and confirm with another indicator before committing size. Most professionals skip this level entirely.
- 0.5 tag — your first legitimate look. The midpoint gets attention from every retail algorithm and every prop desk running automated Fib strategies. Expect a reaction — but don't trust it until a candle close above the level is in.
- 0.618 tag — where you size in, but with conditions. Healthy pullbacks in a strong uptrend bottom here. If price holds and prints a higher low on the timeframe you're trading, the risk-to-reward tilts sharply in your favor.
Watch the 0.786 trap. When price gets that deep on a clean hourly or daily close, the uptrend structure is usually compromised — you're no longer buying a dip, you're catching a falling knife in a market that just shifted character. V-recoveries off 0.786 happen. They're not trades you can build a process around.
| Level | Setup Quality | Required Confirmation | Action Bias |
|---|---|---|---|
| 0.382 | Weak, trap-prone | Strong (RSI div + volume dry-up + HTF support) | Skip or scalp only |
| 0.500 | Decent, first entry | Moderate (RSI div or volume expansion) | Wait for candle close above |
| 0.618 | Primary, size candidate | Mandatory (RSI div + volume follow-through) | Size only on confirmed hold |
The numbers aren't a hierarchy of safety. They're a hierarchy of confluence. A clean 0.5 tag with RSI divergence and a volume dry-up beats an unconfirmed 0.618 tag every time.
Integrating RSI and Volume to Confirm Support
A naked Fibonacci level is narrative, not signal. Drawing lines on a chart doesn't confirm anything — it just marks where buyers might appear. Confirmation comes from what the market does at the level, not from where you drew the line.
RSI divergence is your highest-probability tell. When price tags 0.5 or 0.618 and RSI prints a higher low (bullish divergence) while price prints a lower low, buyers are quietly absorbing supply beneath the surface. That disagreement between price and momentum is the strongest non-news signal you'll get. Hidden divergence — where RSI makes a lower high while price makes a higher high — is also useful at the top of impulsive legs.
Volume is your second filter. Watch for volume dry-up into the level, then expansion off it. If price tags 0.618 on declining volume and reclaims the level on a strong volume candle, you have a high-confluence setup. If price tags 0.618 on a volume spike with no follow-through on the bounce, that's distribution — sellers unloading into apparent demand. Stay flat until the picture clears.
Timeframe alignment is the tiebreaker. A 0.618 bounce that shows up only on the 15-minute chart while the 4H is still bleeding lower is not a trade — it's a scalp inside hostile territory. The level needs to align across at least two timeframes (your entry timeframe plus one higher) before the setup earns real capital. Daily Fib + 4H confirmation + 1H entry trigger is the cleanest stack for swing traders.
Naked Fibonacci is narrative, not signal. Until RSI or volume confirms, you're trading hope, not structure.
Confirmation before commitment is non-negotiable discipline — it applies anywhere a decision is being made on incomplete data. The same logic that demands RSI divergence before trusting a Fib level is what keeps a serious operator from launching into a category without first verifying demand, unit economics, and competitive density. Different domain, same filter.
Avoiding False Breakouts at Deep Retracement Levels
The biggest mistake traders make at 0.5 and 0.618 isn't entering too early — it's treating a wick below the level as confirmation of reversal when it's actually a stop hunt engineering liquidity.
When BTC tags 0.618, drops a sharp wick below it to flush weak longs, and reclaims the level within the same candle, that's not bearish — that's liquidity engineering. The candle close matters more than the wick. If price closes back above 0.618 after the wick, the setup remains live. If the close is below, the level failed.
The same trap works in reverse. A wick above 0.382 followed by a close back below often pulls late breakout buyers into the next leg down. Wicks are traps waiting for stops on both sides. Read closes. Read the candle that matters — your trading timeframe's CLOSE, not its intra-candle extremes.
If price closes the 4H or daily below 0.618 on elevated volume, that's not a stop hunt — that's a level failure. The 0.618 thesis is invalidated. You don't average down. You don't "wait for it to come back." You step aside, mark the chart, and reassess on a higher timeframe for new structure.
Same logic at 0.786. A clean tag and close below 0.786 on a daily timeframe means the uptrend structure is broken. Trying to buy the next bounce is catching a falling knife in a market that just shifted regime. Look for fresh structure to form before committing new capital.
Invalidation Criteria — Where the Trade Is Wrong
Strict invalidation rules. Applied without exception. Exceptions are how you end up holding bags through a 30% drawdown.
- Hard close below 0.618 on the timeframe you're trading. Wick below is acceptable. Close below is not — the level failed, the trade thesis is dead.
- No price reaction within 3–5 candles after the tag. A level that gets tested and produces no bounce, no wick, no volume signature is not holding. Move to the next candidate or stay in cash.
- Higher-timeframe structure break. If 4H or daily support gives way while your Fib level is still untested from below, the trade is over before it began — the bigger structure trumps the smaller one.
- RSI making lower lows at the level. Bullish divergence is the minimum requirement for a real setup. If momentum agrees with the downside, the Fibonacci level is decorative and earns zero trust.
- Volume confirmation missing on the bounce. A reclaim on weak or average volume is a coin flip. Walk away.
These aren't suggestions. These are the rules that keep you in the game long enough to be there when the high-conviction setup finally shows up.
The market doesn't owe you a bounce. Three Fibonacci levels — 0.382, 0.5, and 0.618 — give you a framework for where buyers might show up. They don't guarantee anything. Combined with RSI divergence, volume confirmation, and multi-timeframe alignment, they filter out the impulse buys that wreck accounts. Without confirmation, you're paying retail tuition to a market that grades on survival, not optimism. Survival first. Gains second. That's the only order that works.